Understanding the Real Estate Market Shift
The rapid shifts in the real estate market have even the most experienced Realtors feeling disoriented. Just a year ago, homes were selling almost immediately after being listed, often with unusual terms such as waived appraisals and inspections, and more all-cash offers.
Sellers were unlocking significant equity, and buyers were benefiting from historically low interest rates, which increased their purchasing power. Fast forward to today, and market conditions are markedly different.
But how can you tell if what you’re seeing in the field is a one-off situation or indicative of a broader market trend? That’s where access to exclusive data from working with me as your agent is a valuable asset.
Market Stats Provide Essential Context
As with most things, context is key to understanding events. Consider your home on the market today. Is it staying on the market longer than you expected given recent trends? Are buyers being more selective and making more realistic offers? Beyond the specifics of the property, could this shift indicate a broader market trend? Here’s how to find out.
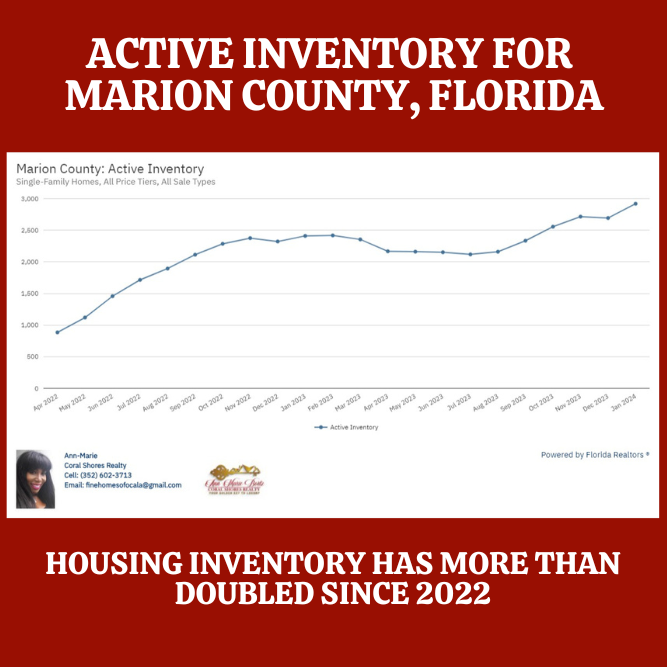
Data can tell a compelling story, but you must know what to look for to see the complete picture. Key metrics like Active Inventory, Median Time to Sale, and Median Sales Price can illuminate the overall health and pace of the real estate market. Simply put, when market supply increases and homes take longer to sell, prices typically decrease.
When active inventory is low and has been decreasing for several months, buyers have fewer options. This increased competition can lead to waived contingencies and higher bids, pushing up the median sale price. As more buyers pay above the asking price and appraisal value, the median sale price rises. By examining these two metrics together, it’s clear that as inventory decreases, median sale prices increase. This illustrates a basic principle of supply and demand – the scarcer something is, the more expensive it becomes.
Since hitting a low in February 2022, active inventory has been increasing each month. Although median sale prices are still high, the growth rate has slowed, suggesting that the increased inventory may be reducing buyer competition and leading to more reasonable deals.
Economists also highlight rising interest rates as a factor in declining demand, as higher mortgage costs over the past year have excluded more potential buyers from the market.
Monitoring Market Dynamics
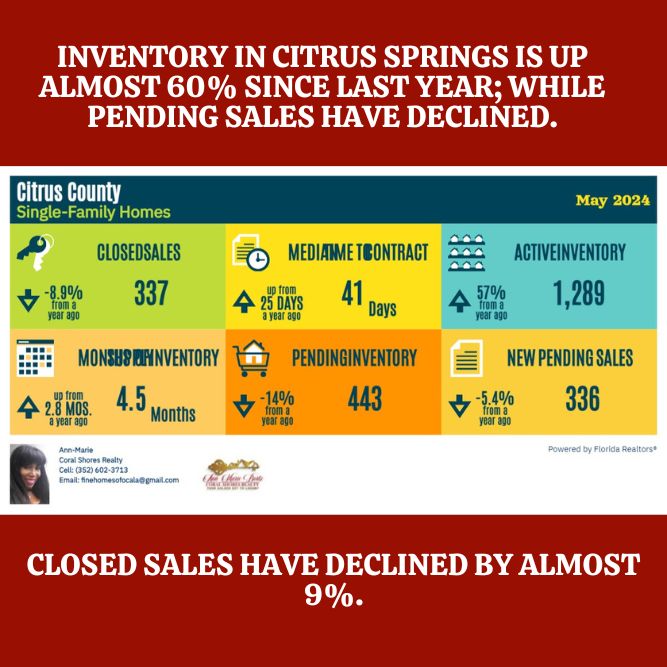
Another crucial metric is the time it takes for deals to go from listing to closing. The faster this happens, the more “frothy” the market is considered. Before the pandemic, a typical single-family home in Florida took about 90 days to close, allowing time for buyers to explore options, conduct due diligence, sell their own homes, and secure traditional financing.
However, when inventory shrank, demand surged, and buyers sought to upgrade, take advantage of low interest rates, or leave rentals, the rules changed. Increased competition led to a rise in cash deals, which close faster than financed deals.
Quick contracts and multiple offers may no longer be the norm. Understanding these trends and metrics can help you navigate the changing real estate market effectively.
For more information on the data for your county and subdivision, give me a call today at 352-405-1663. Let me put my 23 years of experience to work for you and your family and hang that SOLD sign out for you.
I serve the greater Ocala, Dunnellon, Citrus Springs, Lecanto, Beverly Hills, Gainesville, Crystal River, Homosassa and surrounding cities.
Ann-Marie Bortz, Realtor
Ann-Marie is a real estate agent in the Greater Ocala, Florida area with over 2 decades in the business. She is a veteran of the United States Air Force and her clients know her as a go-getter and pro-active agent specializing in the luxury market.


You May Also Like

4 reasons millennial homebuyers are here to stay
October 11, 2015tips on how to get your listings online
October 11, 2015